Net revenue retention (NRR) is a SaaS metric that measures the percentage of recurring revenue a company keeps and grows from its existing customers over a specific period. It accounts for everything that happens after a customer signs: upsells, cross-sells, downgrades, and cancellations. NRR tells you whether your current customer base is becoming more valuable or slowly bleeding out. For customer success teams, it's the single clearest measure of whether you're building lasting relationships or just managing churn.
TL;DR – What You Need to Know
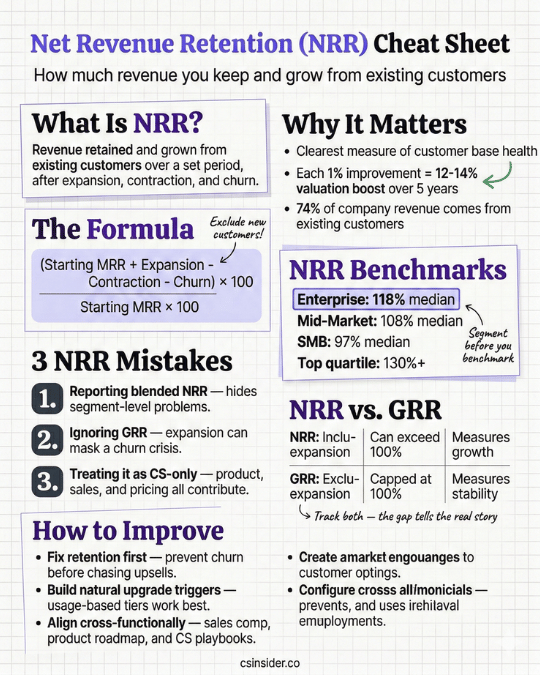
- NRR above 100% means your existing customers generate more revenue over time, even without new sales
- Median NRR across B2B SaaS sits at roughly 106%, with top performers clearing 120%+
- Formula: (Starting MRR + Expansion - Contraction - Churn) / Starting MRR × 100
- Every 1% improvement in NRR can boost company valuation by 12-14% over five years
- CS teams influence NRR but don't own it alone. Product, sales, and pricing all play a role
What is net revenue retention?
Net revenue retention, also known as net dollar retention (NDR), is the percentage of recurring revenue you keep from the same group of customers over a set period, typically a month or a year. It captures every revenue movement from that group: expansion from upsells and cross-sells, contraction from downgrades, and loss from cancellations.
Think of it this way. You start the quarter with 500 customers generating $2M in monthly recurring revenue. By the end of the quarter, some of those customers upgraded, some downgraded, and a few left entirely. NRR calculates how much of that original $2M you still have, plus whatever those same customers added through expansion.
The key word is "existing." NRR strips out new customer revenue entirely. It isolates how your installed base behaves once the deal is signed. That's what makes it so valuable for CS teams. An NRR of 110% means your existing customers generated 10% more revenue than at the start of the period. An NRR of 90% means you lost 10%, and you need new sales just to stay flat.
Why net revenue retention matters in customer success
NRR has become the metric that boards, investors, and C-suites care about most. And for CS leaders, that's both an opportunity and a pressure point.
SaaS Capital research found that each 1% improvement in net revenue retention can increase a company's valuation by 12-14% over five years. That's not a rounding error. It means the difference between 105% and 110% NRR compounds into millions of dollars in enterprise value. According to Software Equity Group, public SaaS companies with NRR above 120% trade at a 63% premium to the overall index median, while those below 100% trade at a 46% discount.
For customer success specifically, NRR matters because it connects your team's daily work directly to company value. Every successful onboarding, every QBR that surfaces an expansion opportunity, every at-risk save that prevents churn moves this number. The 2025 Customer Revenue Leadership Study found that 74% of respondents say most company revenue comes from existing customers. That's your territory.
But here's the tension most CS leaders feel: NRR is increasingly treated as a CS metric even though no single team controls all its inputs. Sales sets expectations. Product builds the features. Pricing determines expansion paths. Your team inherits whatever those functions create and tries to grow it. A 2025 Custify survey found that 62% of CSMs use NRR as their primary metric, which puts enormous pressure on teams that don't always control the levers that move it.
How to calculate net revenue retention
The formula looks intimidating until you break it down. You need four numbers, all from the same group of existing customers:
NRR = (Starting MRR + Expansion MRR - Contraction MRR - Churn MRR) / Starting MRR × 100
Here's what each component means.
Starting MRR is the monthly recurring revenue from a specific group of customers at the beginning of your measurement period. This is your baseline.
Expansion MRR is additional revenue from those same customers through upsells, cross-sells, seat additions, or usage increases. This only counts revenue from customers who were already in your starting group.
Contraction MRR is revenue lost when existing customers downgrade, reduce seats, or move to a lower plan. They're still customers, but they're paying less.
Churn MRR is revenue lost from customers who canceled completely. They're gone.
NRR calculation example
Say you start January with $200,000 MRR from 100 existing customers. During January, 5 customers upgrade, adding $15,000 in expansion. 3 customers downgrade, losing $4,000. And 2 customers cancel, costing you $6,000.
NRR = ($200,000 + $15,000 - $4,000 - $6,000) / $200,000 × 100
NRR = $205,000 / $200,000 × 100 = 102.5%
That 102.5% tells you the existing customer base grew by 2.5% in a single month, before counting any new business. Annualized, that's roughly 34% growth powered entirely by your installed base.
Calculating NRR over different time periods
You can calculate NRR monthly, quarterly, or annually. Most teams track it monthly for operations and report quarterly to leadership. If you calculate over a shorter period, annualize: monthly NRR raised to the 12th power gives you annual NRR. One nuance worth knowing: the cohort method, where you track a specific group of customers from period start to end, is more accurate than formula-based methods that can pick up churn from mid-period acquisitions.
Net revenue retention benchmarks for 2025-2026
Benchmarks vary significantly by company size, segment, and average contract value. Using a single industry average without context can be misleading.
Here's what current data shows across segments, drawn from Optifai's 2026 study of 939 B2B SaaS companies and the ChartMogul dataset of 2,100 companies.
Enterprise-focused companies (large ACV, complex implementations) typically see NRR between 115-125%. These accounts have more seats to add, more departments to expand into, and higher switching costs that reduce churn. Snowflake, for example, has maintained NRR above 130% even as a large public company.
Mid-market companies tend to land around 105-115%. There's less natural expansion surface area than enterprise, but strong product-market fit still drives meaningful growth from the base.
SMB-focused companies often sit between 90-105%. Higher churn rates, smaller contract values, and fewer upsell paths make it harder to offset losses with expansion. An SMB company hitting 100% NRR is doing solid work.
One pattern that surprises people: NRR typically decreases as companies scale. A startup at $5M ARR might post 130% NRR from a small number of rapidly expanding accounts. Once you're at $100M ARR with thousands of customers, keeping NRR above 110% becomes progressively harder because the law of large numbers kicks in.
NRR vs. GRR: why you need both
Net revenue retention and gross revenue retention are companion metrics, and the gap between them tells a critical story.
GRR measures the revenue you keep from existing customers, excluding expansion. It only accounts for contraction and churn. GRR can never exceed 100% because it doesn't include the upside.
Here's why that distinction matters. A company can post 120% NRR and 82% GRR. The NRR looks fantastic on paper. But the GRR reveals this company is losing 18% of its base revenue and masking it with aggressive upselling. That's a treadmill. The moment expansion slows, NRR craters.
Strong CS organizations track both and pay close attention to the gap. McKinsey's 2025 analysis of 100+ B2B SaaS companies found that top-quartile companies earn premium valuations because they combine high GRR (low churn) with strong expansion. The healthiest pattern is GRR above 90% with NRR above 110%. That means you're retaining the vast majority of customers and growing them meaningfully.
If your GRR is below 85%, you have a leaky bucket. Pouring expansion on top just delays the reckoning. Fix retention first, then layer in growth strategies.
Where CS teams get stuck with NRR
CS teams face a few recurring challenges when they're held accountable for NRR.
Expansion without a clear path
You can't grow accounts if the product and pricing don't create natural upgrade triggers. Some CS teams are told to "drive expansion" but work with flat pricing structures, no usage-based tiers, and no cross-sell products. That's a structural problem, not a performance problem. If your biggest expansion play is convincing customers to add seats one at a time, you're bringing a knife to a gunfight.
The most effective expansion happens when customers naturally outgrow their current plan. Usage hits 80% of a tier limit, and the upgrade conversation becomes obvious. If your product doesn't create those natural inflection points, push for pricing and packaging changes rather than asking CSMs to manufacture upsells from thin air.
Treating NRR as a single number
A blended NRR of 106% tells you almost nothing useful. You need to segment it. Break NRR down by customer segment, ACV band, product line, CSM, and customer age. You'll almost always find that enterprise accounts run 120%+ while SMB runs 92%, and the blended number hides both the strength and the weakness.
Segment-level NRR tells you where to invest. If your mid-market segment has 115% NRR and your enterprise segment sits at 98%, your expansion playbook might be strong but your enterprise retention needs work. Benchmarkit.ai research suggests benchmarking NRR by ACV cohort rather than company size or industry average for the most useful comparisons.
Confusing high NRR with healthy retention
A 115% NRR might come from two very different scenarios. In the first, you retain 95% of revenue and grow the remaining base by 20%. In the second, you lose 25% of revenue to churn and offset it with 40% expansion from the accounts that stay. Both produce similar NRR, but the second scenario is fragile. You're churning a quarter of your customer base annually and depending on aggressive upselling to mask it.
This is why the NRR-GRR gap matters so much. Always report both numbers together. Leadership that only sees NRR might celebrate a number that's hiding serious retention problems.
How CS teams improve net revenue retention
Improving NRR means pulling two levers simultaneously: reduce losses (churn and contraction) and increase gains (expansion). Most teams instinctively focus on expansion because it feels more proactive. But a dollar of prevented churn is worth the same as a dollar of expansion, and it's usually cheaper.
Prevent churn before it starts
The biggest NRR improvements come from customer health score systems that catch at-risk accounts early. The 2025 Customer Revenue Leadership Study found that organizations with CSMs, support, enablement, and account management roles all in place reported NRR roughly 4-8 percentage points higher than those without. Customer enablement specifically correlated with 99% NRR when present versus 94% without.
Build your early warning system around product usage, support ticket patterns, executive sponsor engagement, and renewal timelines. If you're only hearing about churn risk 30 days before renewal, you're already too late.
Make expansion a natural outcome
The best expansion doesn't feel like a sales pitch. It feels like the obvious next step when customers are succeeding. Tie your quarterly business reviews to business outcomes, not feature walkthroughs. When a customer sees concrete ROI from their current investment, expanding makes intuitive sense.
McKinsey found that companies with sophisticated value realization and adoption programs produce NRR about seven percentage points higher than peers with basic approaches. These companies align on clear onboarding and adoption goals with customers from day one, then track progress against those milestones throughout the relationship.
Get cross-functional alignment
NRR reflects the work of every team that touches the customer. Sales compensation that rewards short-term deals without retention gates creates bad fit customers who churn within a year. Product teams that ship features nobody adopts don't drive expansion. Marketing that overpromises sets up CS for failure at renewal.
When sales comp includes a retention component, when product uses adoption data to prioritize the roadmap, and when marketing messaging reflects what the product actually delivers, NRR improves across the board.
Frequently asked questions about net revenue retention
Q: What is a good net revenue retention rate?
A: It depends on your segment and average contract value. For enterprise SaaS, 115-125% is strong. For mid-market, 105-115% is solid. For SMB-focused businesses, anything above 100% indicates healthy growth from the base. The median across all B2B SaaS companies is roughly 106% as of 2025. More importantly, track your NRR trend over time rather than fixating on a single benchmark.
Q: Is NRR the same as net dollar retention?
A: In most practical contexts, yes. Net revenue retention (NRR) and net dollar retention (NDR) refer to the same calculation and are used interchangeably in the customer success and SaaS industries. Some finance teams draw a technical distinction, but for CS reporting and benchmarking purposes, they measure the same thing.
Q: How often should you measure NRR?
A: Track NRR monthly for operational visibility, report it quarterly to leadership, and benchmark it annually against industry standards. Monthly tracking lets you spot trends early. Quarterly reporting smooths out noise from individual large accounts churning or expanding. Annual benchmarking gives you the most reliable comparison to industry peers.
Q: Can NRR be too high?
A: Extremely high NRR (above 150%) can signal aggressive upselling that might not be sustainable or may indicate pricing that started too low. It can also mask problems if expansion is concentrated in a few large accounts. That said, consistently high NRR usually reflects strong product-market fit and healthy customer relationships. Context matters more than the raw number.
Q: Why does NRR drop as companies grow?
A: Larger customer bases are harder to expand at high percentages due to the law of large numbers. Growing a portfolio of 250 customers by 30% is fundamentally different from growing 25,000 customers by 30%. As companies scale, they also serve more diverse customer segments with varying expansion potential. This is normal and expected.
Q: How does NRR affect company valuation?
A: Significantly. Research from SaaS Capital found that each 1% increase in NRR can boost valuation by 12-14% over five years. Public SaaS companies with NRR above 120% command premium revenue multiples, sometimes 2-3x higher than peers below 100%. Investors view high NRR as evidence of sustainable, capital-efficient growth.
Q: Should CS teams own NRR?
A: CS teams heavily influence NRR through retention, adoption, and expansion activities, but no single team controls all the inputs. Product, sales, pricing, and marketing all affect NRR. The most effective approach is shared accountability where CS leads the charge on retention and expansion while other teams own the upstream factors like product quality and customer fit.
Conclusion
Net revenue retention is the clearest measure of whether your customer base is becoming more valuable over time. For CS teams, it connects daily relationship work to the financial metrics that drive company valuation and strategic decisions. The organizations that win on NRR don't treat it as a single team's responsibility. They build systems where product, sales, pricing, and CS all contribute to keeping and growing the customers they've earned.
Key takeaways
- Track NRR alongside GRR to get the full picture. High NRR with low GRR signals fragile growth that depends on expansion to mask churn.
- Segment your NRR by ACV, customer size, and product line. Blended numbers hide both your strengths and your blind spots.
- Fix retention first, then layer in expansion. A dollar of prevented churn is worth the same as a dollar of upsell, and it's more sustainable.
What to do in the next 7 days
- Pull your NRR and GRR numbers for the last four quarters. If you can only get blended figures, push your ops team to segment by ACV band or customer tier so you can see where the real story is.
- Identify your top 5 expansion accounts and top 5 at-risk accounts using product usage, engagement, and support data. Map specific next steps for each one.
- Schedule a cross-functional meeting with sales, product, and CS leadership to review which customers churned last quarter, why they left, and whether any upstream changes (pricing, onboarding, qualification) could have changed the outcome.