What is churn?
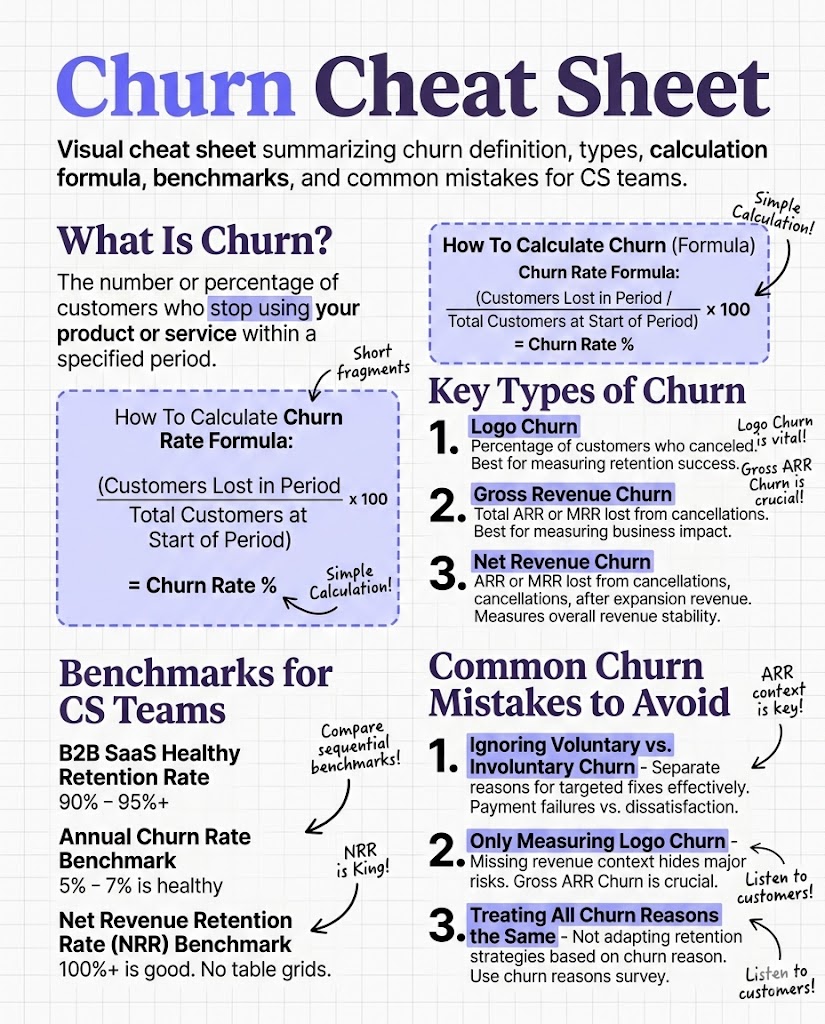
Churn is the loss of customers or revenue over a defined time period. When a customer cancels their subscription, doesn't renew their contract, or stops using your product entirely, that's churn. The metric is typically expressed as a percentage, called a churn rate, calculated by dividing the number of customers lost during a period by the total number of customers at the start of that period.
The concept sounds simple, but the way you define and measure churn shapes how you understand your business. A company tracking only monthly cancellations will miss the customer who quietly stopped logging in three months ago. A company focused solely on logo churn might overlook that their biggest accounts are downgrading, even though the customer count looks stable.
For CS teams, churn is personal. Every lost customer represents a relationship that didn't deliver the outcomes it promised. And because customer success typically owns retention metrics, churn rate is the number leadership looks at when evaluating your team.
TL;DR – What You Need to Know
- Churn rate measures the percentage of customers or revenue lost over a specific period
- The average B2B SaaS annual churn rate is approximately 3.5%, with voluntary churn at 2.6% and involuntary at 0.8%
- Customer churn counts lost logos; revenue churn measures lost dollars, and they can tell very different stories
- Most churn happens in the first 90 days, making onboarding your highest-leverage retention tool
- Reducing churn by just 5% can increase profits by 25-95%, depending on your business model
Why churn matters more than most metrics
Churn is a compounding problem. A monthly churn rate of 5% might not sound catastrophic until you do the annual math. That 5% monthly rate means you're losing nearly 46% of your customer base every year. You'd need to replace almost half your customers just to stay flat, let alone grow.
The economics make it even more painful. According to Harvard Business Review, acquiring a new customer costs five to 25 times more than retaining an existing one. Every churned customer represents not just lost revenue, but wasted acquisition spend. And the customers who leave don't stay quiet. Negative reviews and word-of-mouth warnings can poison your pipeline for months.
Bain & Company's research found that reducing churn by 5% can boost profits by 25% to 95%.
Here's what makes churn particularly dangerous for growing companies. When sales is bringing in new logos at a healthy clip, churn can hide behind net growth. You're adding 50 customers a month but losing 30. The dashboard shows +20, and everyone celebrates. Meanwhile, your customer lifetime value is shrinking, your CAC payback period is stretching, and the team is running faster just to stay in place.
Types of churn every CS team should track
Not all churn is the same, and understanding the differences changes how you respond.
Customer churn (logo churn)
This is the most straightforward measure: how many customers left during a given period? If you started the quarter with 500 customers and ended with 475, you lost 25 logos. Your customer churn rate is 5%.
Logo churn tells you about product-market fit and customer satisfaction at a high level. It's the pulse check. But it treats a $500/month startup the same as a $50,000/month enterprise account, which limits its usefulness on its own.
Revenue churn
Revenue churn measures the recurring revenue lost from cancellations and downgrades. This is where the financial picture gets sharper. You might lose 10 small accounts and gain two enterprise upgrades, resulting in net positive revenue even with logo churn.
Revenue churn comes in two forms. Gross revenue churn counts only losses. Net revenue retention factors in expansion revenue from upsells and upgrades, showing whether your installed base is growing or shrinking. Elite B2B SaaS companies target NRR above 120%, meaning existing customers generate more revenue over time even after accounting for churn.
Voluntary churn
This is when customers actively choose to leave. They cancel their subscription, send a non-renewal notice, or explicitly tell you they're done. The causes typically include poor product fit, unmet expectations, competitive alternatives, or a failure to achieve their desired outcomes. Voluntary churn is the type CS teams have the most influence over, because the root causes are usually related to value delivery, relationship management, and proactive engagement.
Involuntary churn
Involuntary churn happens without the customer intending to leave. Failed credit card payments, expired billing information, and technical processing errors account for the majority. According to the 2025 Recurly Churn Report, involuntary churn in B2B SaaS averages about 0.8% annually. It's a smaller number than voluntary churn, but it's also the most fixable. Automated card updaters, smart payment retry logic, and dunning campaigns can recover a significant portion of involuntary churn with relatively low effort.
How to calculate churn rate
The basic formula is straightforward:
Churn rate = (Customers lost during period ÷ Customers at start of period) × 100
If you started January with 1,000 customers and lost 40 by month end, your monthly churn rate is 4%.
For revenue churn, the formula shifts:
Revenue churn rate = (MRR lost from cancellations and downgrades ÷ Total MRR at start of period) × 100
A few calculation pitfalls trip teams up regularly. Monthly churn rates compound, so you can't simply multiply your monthly rate by 12 to get your annual number. A 5% monthly churn rate translates to roughly 46% annual churn, not 60%. The formula for annualizing is: Annual churn = 1 - (1 - monthly rate)^12.
The timing of when you count a customer as "churned" also matters. Some companies count churn at cancellation request, others at contract expiration. Pick a consistent definition and stick with it.
Churn rate benchmarks in 2025
Benchmarks help you understand whether your churn rate is healthy relative to peers, but context matters enormously. Your company stage, customer segment, and pricing model all influence what "good" looks like.
According to the 2025 Recurly Churn Report, the average B2B SaaS annual churn rate sits at approximately 3.5%, split between 2.6% voluntary and 0.8% involuntary. A 2025 analysis from Vena Solutions puts the broader SaaS average slightly higher at 3.8% annually, with B2B SaaS specifically at 4.9%.
Company maturity is one of the strongest predictors of churn. Early-stage SaaS companies (under $1M ARR) see monthly churn averaging 6.5%, growth-stage companies ($1-3M ARR) average 3.7%, and scale-stage companies ($8M+ ARR) drop to 3.1%. This reflects better product-market fit, sharper customer targeting, and more mature customer onboarding processes.
The customer segment you serve matters just as much. Enterprise SaaS reports annual churn closer to 3.8%, while SMB-focused products sit around 7.5%. The difference comes from contract length, switching costs, and the number of decision-makers involved.
Industry vertical adds another layer. Infrastructure and security SaaS reports the lowest churn at around 1.8% monthly. Marketing and sales tools see the highest at 4.8-8.1%, reflecting intense competition and low switching costs.
Where CS teams have the most leverage on churn
You can't control every factor that drives churn. Market downturns, acquisitions, and organizational restructuring happen regardless of how well you manage the relationship. But there are specific areas where CS effort directly reduces attrition.
The first 90 days
Most churn happens early. Customers who don't reach their first meaningful outcome within the first few months are significantly more likely to leave. This makes onboarding your single highest-leverage retention investment.
Strong onboarding isn't about product training. It's about helping the customer connect your tool to the business problem they're trying to solve. A customer who can articulate "this platform helps us do X, which matters because of Y" is far harder to churn than one who completed a setup wizard but never built a workflow that stuck.
Health scoring that drives action
A customer health score is only useful if it triggers specific actions. Too many CS teams build health models that look sophisticated on a dashboard but don't change daily behavior. The score should tell a CSM what to do: which account to call, what topic to raise, and what outcome to push toward.
Companies that use health scores to trigger proactive interventions reduce churn by 16-28% in subscription models, according to a 2025 retention analysis. The key is acting on the signal before the customer shows obvious signs of disengagement.
The signals hiding in plain sight
The most dangerous churn doesn't announce itself. Three patterns consistently predict attrition before the customer says a word: declining login frequency over 60 days, reduced stakeholder engagement (your champion stops joining calls), and a shift from strategic conversations to tactical support requests. If your QBR discussions move from "how do we expand this initiative" to "can you help me pull a report," that account is drifting.
Multi-threading relationships
When your single point of contact leaves, your account becomes vulnerable overnight. Building relationships across multiple stakeholders insulates you from champion turnover. ChurnZero's 2025 analysis flagged "championless" accounts as a top churn threat, and the remedy is deliberate relationship-building before the departure happens, not scrambling afterward.
The uncomfortable truth about "acceptable" churn
There's a tempting narrative in SaaS that some churn is healthy. Losing bad fit customers frees resources. Shedding low-value accounts improves unit economics. That's partially true. But it's also a rationalization that lets teams avoid confronting preventable losses.
The distinction matters. Churn you planned for (exiting a customer segment, sunsetting a product tier) is strategic. Churn you didn't see coming is the number that demands attention. Lumping both together creates a false sense of comfort.
Segment your churn reporting. Track gross retention rate for your ICP-matched accounts separately from your overall base. If your best-fit customers churn at similar rates to everyone else, you have a product or delivery problem that no amount of customer segmentation will solve.
Frequently asked questions about churn
Q: What is a good churn rate for SaaS?
A: For established B2B SaaS companies, annual churn below 5% is considered healthy. Enterprise-focused products should aim even lower, around 3-4%. Early-stage companies will see higher rates as they refine product-market fit, with monthly churn of 3-5% being common for SMB-focused products.
Q: What is the difference between customer churn and revenue churn?
A: Customer churn counts the number of accounts lost, treating each equally regardless of size. Revenue churn measures the recurring revenue lost from cancellations and downgrades. You could lose 10 small accounts while one enterprise customer upgrades, resulting in high logo churn but positive net revenue retention.
Q: How do you calculate annual churn from monthly churn?
A: Use the formula: Annual churn = 1 - (1 - monthly rate)^12. Don't multiply monthly churn by 12, as churn compounds. A 5% monthly churn rate equals roughly 46% annual churn, not 60%. This compounding effect is why even small monthly improvements create significant annual gains.
Q: What causes customer churn in SaaS?
A: The most common drivers are poor onboarding that delays time-to-value, product-market fit issues, inadequate customer support, competitive alternatives, budget constraints, and internal champion turnover at the customer organization. Budget limitations top stated cancellation reasons at 33%, though many of those mask deeper product-value misalignment.
Q: What is involuntary churn and how do you fix it?
A: Involuntary churn happens when customers lose access due to failed payments, expired cards, or billing errors rather than a deliberate cancellation. It accounts for roughly 0.8% of annual B2B SaaS churn. Automated card updaters, smart payment retry logic, dunning email campaigns, and in-app payment walls can recover a significant portion.
Q: Is some churn actually healthy for a business?
A: Strategic churn, like exiting a customer segment that doesn't fit your product, can improve unit economics and team focus. But most churn isn't strategic. The key is separating planned attrition from preventable losses and tracking each independently. High churn among your ideal customer profile is never healthy.
Q: How does churn relate to net revenue retention?
A: Net revenue retention accounts for both churn losses and expansion revenue from existing customers. A company with 5% gross churn but 25% expansion revenue has an NRR of 120%, meaning the existing customer base is growing despite some accounts leaving. Top-performing SaaS companies target NRR above 115-120%.
Conclusion
Churn is the metric that reveals whether your customers are achieving the outcomes they signed up for. Every point of improvement in your churn rate compounds over time, making retention one of the highest-leverage investments a CS team can make. The companies that treat churn as a product, sales, and success problem, rather than just a CS problem, are the ones that build sustainable growth.
Key takeaways
- Track customer churn and revenue churn separately, as they tell different stories about the health of your business
- Focus retention efforts on the first 90 days, where most preventable churn originates
- Segment your churn data by customer fit, because losing bad fit accounts is different from losing your best customers
What to do in the next 7 days
- Run your churn calculation three ways. Calculate your monthly customer churn, monthly revenue churn, and net revenue retention. Compare the stories each metric tells. If they diverge significantly, that's where your investigation should start.
- Audit your last 10 churned accounts. Classify each as voluntary or involuntary, and for voluntary losses, identify whether the root cause was onboarding-related, product fit, champion loss, or competitive displacement. Look for the dominant pattern.
- Check your first-90-day retention. Pull the percentage of customers who are still active 90 days after signing. If it's below 85%, that's your highest-priority fix before any other retention initiative.