What is a customer health score?
A customer health score is a data-driven metric that tells you how likely a customer is to stay, grow, or leave. Think of it like a credit score for your customer relationships. Just as lenders use credit scores to predict loan defaults, CS teams use health scores to predict churn before it happens.
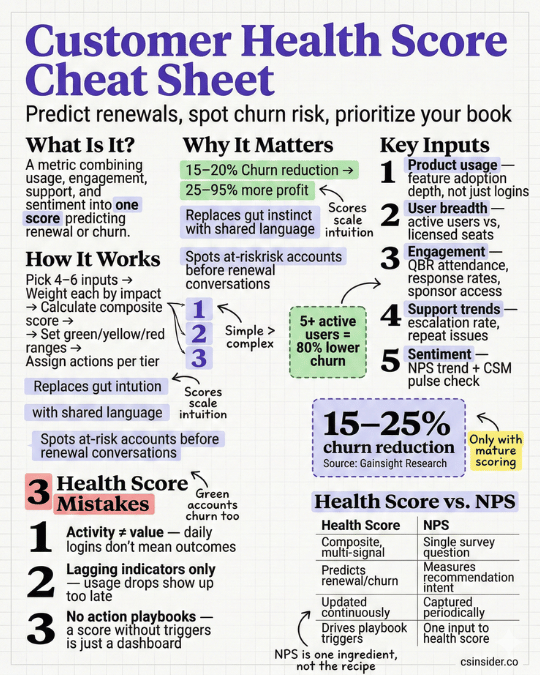
The score pulls from multiple data sources. Product usage, support ticket patterns, survey responses, stakeholder engagement, and CSM observations all feed into the calculation. Each input gets a weight based on how strongly it correlates with actual outcomes at your company, and the weighted combination produces a single number your team can act on.
At 20 customers, your CSMs know every account personally. At 200, that personal knowledge breaks down. Health scores scale intuition by turning scattered signals into a prioritization engine. A score of 82 means something specific. A score of 34 triggers specific actions. Without that shared language, every CSM is operating on their own interpretation of what "at risk" means.
Most companies display scores on a 0–100 numerical scale or as red/yellow/green status. The numerical approach tends to work best because it gives you more granularity. A customer at 45 needs a different conversation than one at 25, but both show up as "red" in a traffic-light system.
TL;DR – What You Need to Know
- A customer health score combines multiple signals into one metric that predicts renewal, expansion, or churn
- Companies with mature health scoring reduce churn by 15–25% and increase NRR by 10–20 points
- The best scores track 4–6 focused inputs, not dozens of vanity metrics
- Activity alone doesn't equal health. A customer logging in daily can still churn if they're not reaching outcomes
- Scores only work if your team trusts them enough to act on what they show
Why customer health scores matter in customer success
The math behind retention makes health scoring essential. Bain & Company's widely cited research found that increasing customer retention by just 5% can boost profits by 25% to 95%. Health scores give you the early warning system to protect that retention before it erodes.
Without a health score, CS teams spend time on the wrong accounts. You might over-invest in a customer who's already committed to renewing while ignoring one whose usage quietly dropped 40% last month. According to Gainsight research, companies with mature health scoring reduce churn by 15–25% and increase net revenue retention by 10–20 percentage points compared to those without systematic health assessment.
Health scores also create a shared language across the organization. When CS, sales, product, and leadership all reference the same score, alignment improves. Gainsight's 2025 CS Index found that 94% of CS organizations now collaborate cross-functionally on customer strategy. Health scores provide the common framework those conversations need.
There's also an expansion angle most teams underutilize. Scores above a certain threshold don't just signal "safe." They signal opportunity. Healthy customers with strong engagement are your best candidates for upsells, cross-sells, and advocacy programs.
What goes into a customer health score
The inputs you choose determine whether your score predicts anything useful. Most successful models combine four to six categories, though the specific metrics depend on your product and customer base.
Product usage and adoption
Usage is the heartbeat of customer health, but raw login counts can mislead you. A customer logging in every day to export a single report isn't as healthy as one using your core workflow features three times a week. Focus on product adoption depth: how many key features they're using, how many users are active, and whether usage is trending up or down.
Totango research found that accounts with five or more active users have 80% lower churn than single-user accounts. That makes seat penetration one of the strongest predictive signals you can track. If only one person at a company knows how to use your product, you're one resignation away from churn.
Engagement and relationship quality
Beyond product data, track how engaged customers are with your team. Meeting attendance, email response rates, QBR participation, and executive sponsor involvement all signal relationship strength. Gainsight reports that engagement scores predict 50–60% of churn independent of product usage. Declining response rates precede roughly 70% of churn events, according to Outreach.io research.
Support interactions
Support ticket data tells two stories. High ticket volume with fast resolution and positive sentiment often indicates normal adoption friction. High volume with repeat escalations and negative sentiment is a red flag.
Don't just count tickets. Look at their nature. A customer filing tickets about advanced functionality is in a different place than one struggling with basics they should have mastered during onboarding.
Sentiment and feedback
Net Promoter Score, CSAT surveys, and qualitative feedback from CSMs all contribute sentiment data. These inputs capture things that usage data misses, like political changes inside the customer's organization, budget pressure, or a champion who's quietly job hunting.
The CSM pulse check, a subjective assessment from the person who knows the account best, remains one of the most predictive inputs in any health model. Vitally found that combining objective data with CSM judgment produces more reliable scores than either source alone.
How to build a health score your team trusts
Here's where most health score initiatives stall. Teams spend months perfecting the formula, launch a dashboard, and watch CSMs ignore it because the scores don't match reality.
Start with what "healthy" looks like for your business
Before choosing any metrics, define what success means for your specific product and customer base. A project management tool might define health around daily active users and task completion rates. A data analytics platform might weight integration depth and query volume. Your definition of healthy should reflect your unique business model, not a generic template.
A useful exercise: pull your last 20 renewals and your last 20 churns. Map backward to identify which signals were present six months before each outcome. The patterns that emerge become your scoring inputs.
Keep it simple enough to explain
A health score with 15 inputs and 12 different weights might sound thorough. In practice, if nobody on your team can explain how it works, it won't get used. Vitally advocates for a four-metric framework: product setup, product usage rate, NPS, and CSM pulse. That focused approach produces scores that are understandable, actionable, and trustworthy.
Start with four to six inputs that your team agrees are meaningful. You can add complexity later once you've validated that the base model predicts outcomes accurately. Simplicity at launch builds the credibility you need for long-term adoption.
Segment by customer type
A health score of 72 might be excellent for a startup running a lean implementation, but a warning sign for an enterprise account with 200 seats and a $500K contract. Customer segmentation is critical. Build different scoring thresholds (and potentially different input weights) for your major customer segments.
Common segmentation dimensions include company size, lifecycle stage, product tier, and use case. Without this segmentation, your score flattens your entire customer base into one generic model, which leads to missed risks in enterprise accounts and false alarms in SMB.
Validate against actual outcomes
Your health score is a hypothesis until you prove it predicts real results. After three to six months, compare predictions against actual renewals and churns. How often did low scores correlate with churn? How often did high-scoring accounts renew? The most effective CS teams review their scoring model quarterly and adjust based on what they learn.
Where health scores go wrong
Every CS professional has a story about the green account that churned without warning. These aren't edge cases. They reveal structural problems that undermine most scoring models.
Mistaking activity for value
This is the most common failure. Logins, clicks, and page views are easy to track, but they don't measure whether the customer is actually reaching their goals. A customer can log in daily and still question the ROI of your product. If your score relies heavily on activity metrics without connecting them to outcomes, you'll generate confidence in accounts that are quietly evaluating alternatives.
The fix: weight metrics that reflect value delivery. Feature adoption depth, workflow completion rates, and integration usage are stronger indicators than raw session counts.
Building on lagging indicators
Most health scores rely on usage trends, support tickets, and NPS, all of which are lagging indicators. By the time those numbers turn red, the customer has often already decided to leave emotionally. As CS Insider's analysis of health score failures points out, these signals show you where the fire already is, not where the smoke is starting.
Balance lagging indicators with leading ones. Stakeholder engagement changes, executive sponsor turnover, and response rate declines all show up before usage drops. ClientSuccess research found that strong executive relationships reduce churn risk by 40%, making sponsor tracking one of the most valuable early signals.
Ignoring the score once it's built
A health score without action playbooks is just a dashboard nobody looks at. When a customer drops below 60, what happens? Who investigates? What's the escalation path? The score itself doesn't save customers. Your team's response does.
Build intervention playbooks that trigger at specific thresholds. A score between 50–70 might trigger a proactive check-in. Below 50 might trigger an urgent account review with a structured success plan. Above 80 could trigger an expansion conversation. The playbook turns the number into a workflow, and the workflow is what actually prevents churn.
Frequently asked questions about customer health scores
Q: What is a customer health score?
A: A customer health score is a composite metric that predicts the likelihood a customer will renew, expand, or churn. It combines product usage, engagement, support interactions, and sentiment data into a single rating, typically displayed on a 0–100 scale or as red/yellow/green status, so CS teams can prioritize their time effectively.
Q: How do you calculate a customer health score?
A: Select four to six key metrics that correlate with retention at your company, such as product usage, feature adoption, support patterns, and engagement. Assign each a weight based on its predictive strength. Multiply each metric by its weight, sum the results, and group customers into health categories like Healthy (71–100), At Risk (31–70), and Critical (0–30).
Q: What metrics should be included in a customer health score?
A: The most predictive inputs typically include product usage depth, user adoption breadth, support ticket trends, NPS or CSAT scores, stakeholder engagement levels, and CSM qualitative assessments. The specific mix depends on your product and business model. Focus on four to six signals that connect directly to renewal outcomes.
Q: How often should customer health scores be updated?
A: Health scores should update automatically as new data flows in, ideally daily or weekly. Manual inputs like CSM pulse checks can update monthly or after significant customer interactions. Stale scores erode trust. If CSMs see a score that doesn't reflect what happened last week, they'll stop checking it.
Q: Why do customer health scores sometimes fail?
A: Health scores fail when they rely too heavily on vanity metrics like login counts, use a one-size-fits-all model across different customer segments, include too many inputs that make the score unexplainable, or lack intervention playbooks that tell CSMs what to do when scores change. The most common failure is building a score nobody trusts or acts on.
Q: What is the difference between a customer health score and NPS?
A: NPS measures one thing: how likely a customer is to recommend your product. A health score is broader, combining NPS with product usage, engagement, support data, and relationship signals into a composite prediction. NPS is one input to health scoring, not a replacement for it. A customer can give you a 9 on NPS and still churn if their executive sponsor leaves.
Q: Can AI improve customer health scoring?
A: Yes. AI-powered models can identify churn patterns invisible to manual analysis, predict risk three to six months in advance, and automatically surface at-risk accounts. Gainsight's 2025 CS Index found that over 52% of CS organizations now integrate AI into workflows, with churn prediction and sentiment analysis among the top use cases. AI enhances scoring accuracy but doesn't replace the CSM's contextual judgment about individual accounts.
Building a health score that drives action
A customer health score is only as valuable as the decisions it enables. The teams that get health scoring right don't chase perfect formulas. They build simple, credible models their CSMs trust, connect those models to intervention playbooks, and refine them quarterly based on actual outcomes.
Key takeaways
- Start simple with four to six inputs that your team agrees predict retention, then add complexity once the base model is validated
- Segment scores by customer type so thresholds reflect what "healthy" actually looks like for each segment
- Connect every score threshold to a specific action. The number saves nothing. Your team's response is what prevents churn.
What to do in the next 7 days
- Pull your last 10 churns and 10 renewals. Map backward to identify which signals were visible three to six months before the outcome. Write down the three to four metrics that showed up most consistently.
- Audit your current score (or draft your first one). If you have a health score, check whether your CSMs can explain how it works in one sentence. If they can't, simplify it. If you don't have one, use those three to four metrics from step one to build a v1.
- Create one intervention trigger. Pick a score threshold (e.g., drops below 60) and document the specific actions your team should take when an account crosses it. Assign ownership and a response timeline.